
I have now run this exact test three times. Same 50 prompts, same 10 categories, same five-intent structure inside each one, three different AI systems. ChatGPT, Claude, and Google AI Mode all answered the identical questions about headphones, laptops, running shoes, coffee makers, office chairs, robot vacuums, moisturizers, air fryers, smartwatches, and travel backpacks.
I built each round separately and wrote about each one on its own. Putting them side by side is where it gets interesting. Across the nine categories with a complete general-query result on all three engines, that plainest possible question produced a unanimous winner 44 percent of the time. Two out of three engines agreed 33 percent of the time. All three engines gave a different answer 22 percent of the time. That gap is the real finding here.
Table of Contents
How I Ran This Comparison
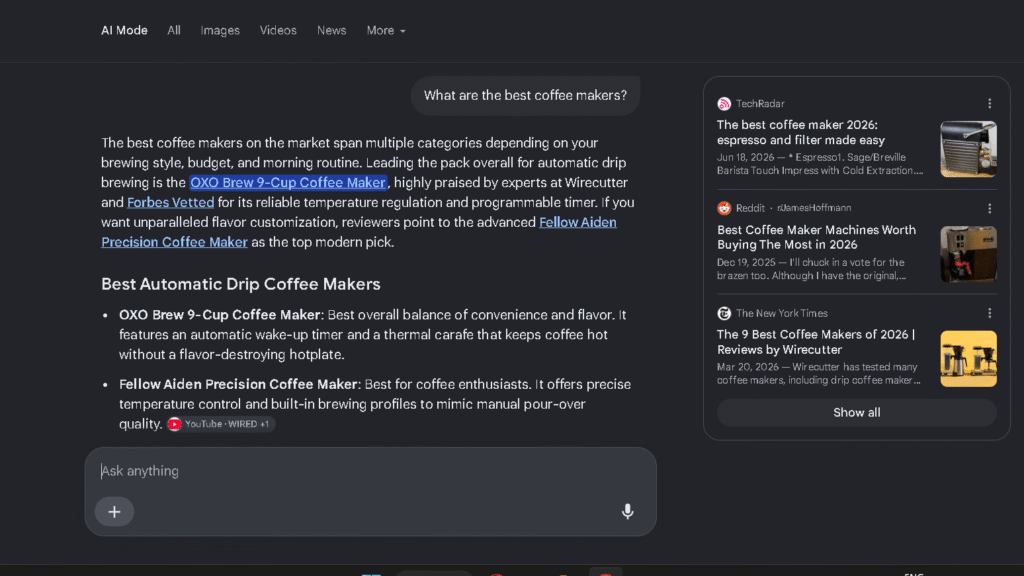
Each engine got the same 50 prompts: one general “best” question per category, then four variations built around budget, use case, audience, or a price ceiling. I recorded the first concrete product named as the number one pick in every response, across all three tools.
The testing conditions were not identical, and I want to say that plainly before anything else. ChatGPT ran in fresh chats with no prior context. Claude ran inside an account that had some conversational history already loaded, which occasionally surfaced in the answers. Google AI Mode ran as a third, separate pass. Each prompt was tested once per engine. None of this was rerun to check for day-to-day drift.
One more honest gap. The Google AI Mode round did not preserve full five-prompt detail for two categories, laptops and running shoes. Running shoes lost even the general query, so that category is excluded everywhere in this comparison, including the agreement count below. Laptops is different. The general-query result for that category, the plain “what are the best laptops” answer, was preserved intact from the same session. The four narrower laptop prompts were not. So laptops appears as incomplete in the concentration table further down, which needs all five results, but it still counts in the agreement comparison, which only needs the one general-query answer.
The Big Picture: How Concentrated Was Each Category, Per Engine
Here is how many different brands took the number one spot within each five-prompt category, side by side across all three engines. This table needs all five prompts per category, so laptops and running shoes show as incomplete here even though laptops still has a valid general-query result for the comparison further down.
| Category | ChatGPT | Claude | Google AI Mode |
|---|---|---|---|
| Wireless headphones | 3 | 2 | 3 |
| Laptops | 2 | 2 | Incomplete data |
| Running shoes | 5 | 4 | Incomplete data |
| Coffee makers | 5 | 5 | 3 |
| Office chairs | 4 | 4 | 4 |
| Robot vacuums | 4 | 3 | 2 |
| Moisturizers | 2 | 1 | 3 |
| Air fryers | 2 | 2 | 4 |
| Smartwatches | 4 | 4 | 4 |
| Travel backpacks | 1 | 4 | 3 |
A few things jump out immediately. Smartwatches and office chairs land on the same number across all three engines, which almost never happens with data like this. Travel backpacks swing the hardest, from a complete lock in ChatGPT to heavy fragmentation in Claude. I will get to both of those in detail.
The Cross-Engine Agreement Rate
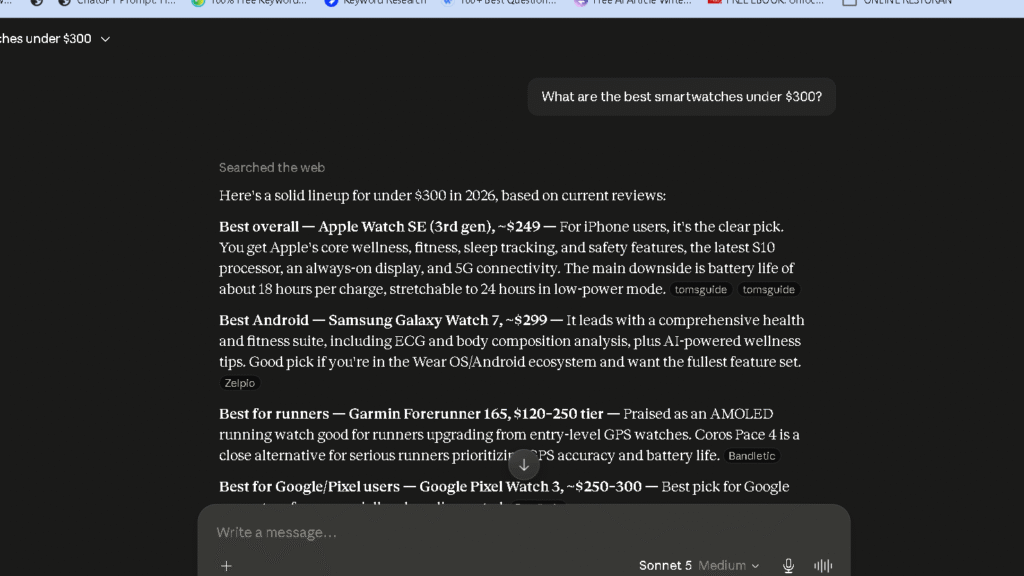
The concentration table shows how scattered each category was inside one engine. It does not show whether the engines agreed with each other, so I built a second measurement for that. I am calling it the Cross-Engine Agreement Rate, and it is simple by design. Take the general “best” query for every category with a complete result on all three engines, and check whether ChatGPT, Claude, and Google AI Mode named the same brand.
Nine categories qualify. That includes laptops, since its general-query result survived intact from the Google session even though the rest of that category did not. Running shoes is the one category left out entirely, because Google’s general-query result for running shoes was not preserved at all. Of those nine, four came back unanimous, three came back with two out of three engines matching, and two came back with three different brands and zero overlap.
That puts full three-engine agreement at 44 percent, partial agreement at 33 percent, and complete disagreement at 22 percent, among the categories I could fully compare.
| Category | ChatGPT | Claude | Google AI Mode | Agreement |
|---|---|---|---|---|
| Wireless headphones | Sony | Sony | Sony | All three agree |
| Laptops | Apple | Apple | Apple | All three agree |
| Moisturizers | CeraVe | CeraVe | CeraVe | All three agree |
| Smartwatches | Apple | Apple | Apple | All three agree |
| Coffee makers | Technivorm | Technivorm | OXO | Two agree |
| Office chairs | Steelcase | Steelcase | Herman Miller | Two agree |
| Robot vacuums | Roborock | Dreame | Dreame | Two agree |
| Air fryers | COSORI | Ninja | Instant Pot | No agreement |
| Travel backpacks | Osprey | Peak Design | Cotopaxi | No agreement |
| Running shoes | Adidas | ASICS | Not recorded | Not comparable |
A 44 percent agreement rate means the same shopper, asking the exact same plain question across three AI tools, gets three matching answers less than half the time. That is worth sitting with before going any further.
Air Fryers: Total Disagreement on the Simplest Question
This is the cleanest example of full disagreement in the whole comparison. ChatGPT’s general query returned the COSORI TurboBlaze. Claude’s returned the Ninja Foodi DZ550. Google AI Mode’s returned the Instant Pot Vortex Plus. Three tools, one identical prompt, three unrelated products.
The pattern held past the general query too. ChatGPT stayed loyal to COSORI across four of its five air fryer prompts, breaking only for the family-sized query, where Ninja took over. Claude split roughly evenly between Ninja and COSORI. Google AI Mode was the least concentrated of the three, cycling through Instant Pot, Gourmia, Ninja, and Cosori across its five prompts, never repeating a brand back to back. So is there a right answer to “best air fryer” right now? Not one that all three tools can agree on.
Travel Backpacks: The Widest Split in the Study
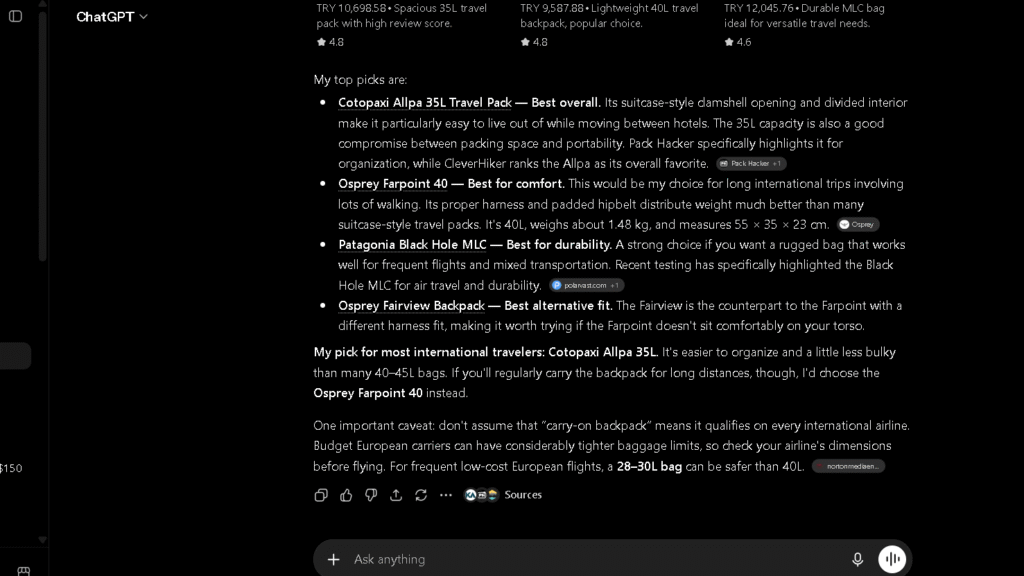
Backpacks produced the sharpest contrast between engines. ChatGPT locked onto Osprey completely. The Farpoint 40 won four of five prompts outright, and Osprey as a brand took the number one position in all five, including the budget prompt, where it answered with the Daylite Carry-On 35L instead.
Claude went the opposite direction, splitting across four different brands: Peak Design, REI, Cotopaxi, and Osprey, with only Peak Design repeating. Google AI Mode landed in between, splitting three ways between Cotopaxi, tomtoc, and Osprey, with Cotopaxi taking the general, carry-on, and international prompts before losing both price-sensitive queries entirely.
That means the exact same shopping question, “what’s the best travel backpack,” would send you home with an Osprey if you asked ChatGPT, a Peak Design if you asked Claude, and a Cotopaxi if you asked Google. That gap is the whole argument for testing more than one engine before trusting any single answer.
Moisturizers: CeraVe Wins Everywhere, Just Not Equally
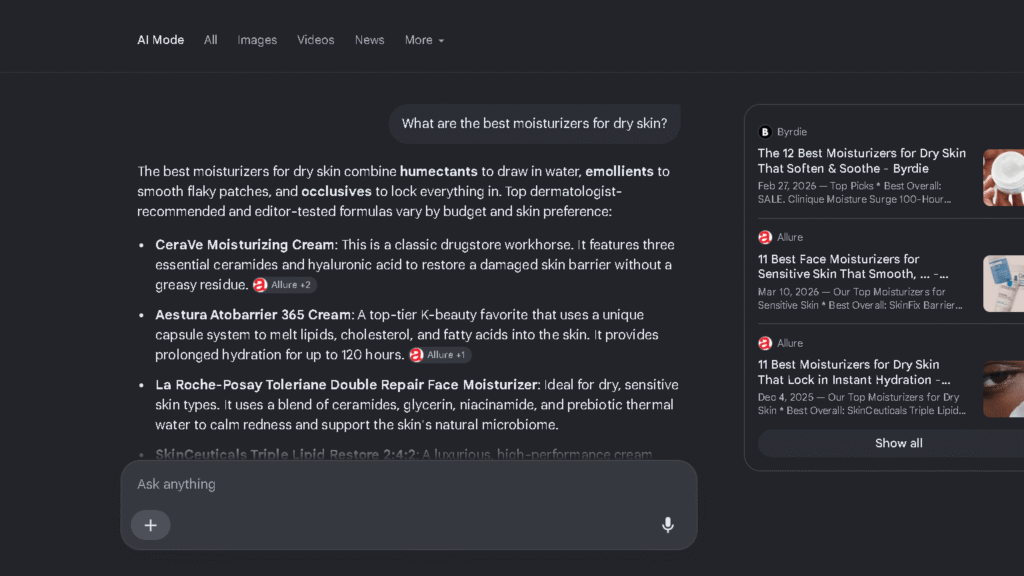
Moisturizers gave me the strongest cross-engine agreement in the study, but the strength of that agreement varied a lot once I looked closer. Claude gave CeraVe a perfect sweep, winning all five prompts including the SPF and under-$30 queries, where the exact product shifted but the brand never did.
ChatGPT came close, with CeraVe taking four of five, only losing the sensitive-skin prompt to Vanicream. Google AI Mode gave CeraVe just two of five, splitting the rest between La Roche-Posay and Clinique. Same brand, same general reputation, three different levels of dominance depending on which engine you asked.
Smartwatches and Office Chairs: The One Pattern All Three Share
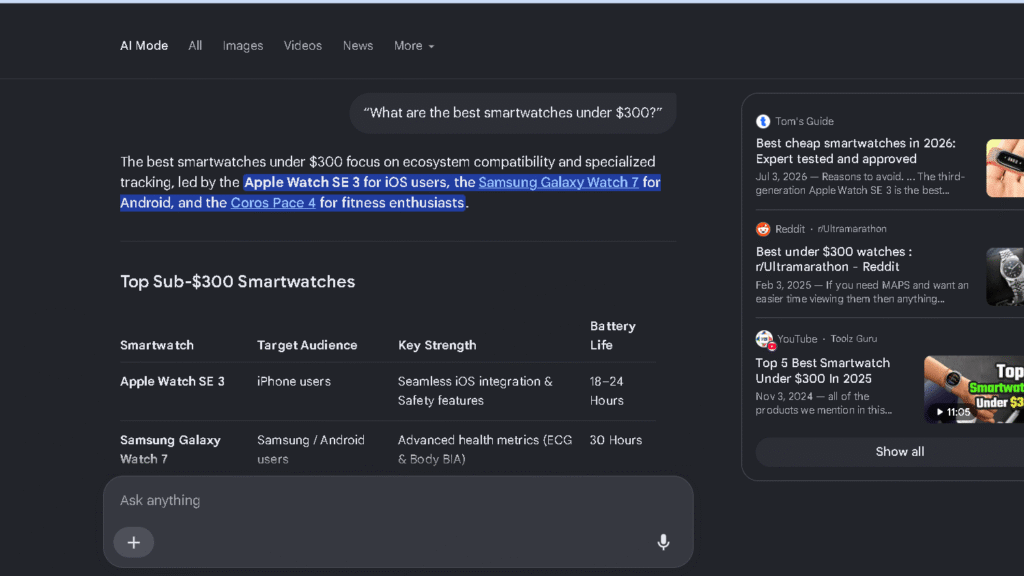
These two categories are the most interesting agreement in the whole comparison, because it is not brand agreement. It is structural agreement. All three engines split smartwatches exactly four ways, and all three split office chairs exactly four ways too.
Smartwatches broke along the same fault line in every single engine: general favors Apple, budget breaks to a cheaper brand, fitness tracking goes to Garmin, and Android compatibility goes to Samsung. That is not a coincidence repeating three times. That looks like a real, shared behavior where compatibility and price override brand loyalty no matter which AI system is doing the answering.
Office chairs followed a similar logic, though the specific winners moved around more. Steelcase or Herman Miller usually took the general and ergonomic prompts, while a budget-focused brand, different in each engine, took the price-constrained queries. The structure repeated even where the names did not.
ChatGPT’s Extra Layer: Sources and Shopping Cards
The ChatGPT round captured something the other two rounds did not track in the same depth: exactly which publishers got cited, and how often a shopping card actually rendered next to the recommendation. WIRED showed up in all five office-chair prompts. Pack Hacker showed up in all five travel-backpack prompts. Neither one was a one-off mention. Both persisted across every version of a closely related question.
The shopping-card data was even more surprising. Across the five travel-backpack prompts, card coverage moved from zero percent, to 67 percent, to 20 percent, to 100 percent, to 100 percent. Same recurring products, same general topic, wildly different visual presentation depending on the exact wording of the question. A brand can win the recommendation and still show up as plain text half the time. That is a second visibility layer sitting on top of the first one, and it is easy to miss if you only track which product got named.
What This Means If You’re Trying to Show Up Everywhere
The practical takeaway changes once you stop treating “AI visibility” as one target. A brand that owns ChatGPT’s answer for a category is not guaranteed the same spot in Claude or Google AI Mode. Osprey proved that by winning ChatGPT’s backpack category outright while placing only occasionally in the other two.
If a brand checks its shopping visibility in only one AI platform, this test suggests it may be seeing a very different picture from the one shoppers encounter elsewhere. The categories with real cross-engine agreement, headphones, laptops, moisturizers, smartwatches, tell a different story. Those are the categories where being a strong, well-reviewed generalist seems to travel across tools. The categories with total disagreement, air fryers and backpacks, suggest a more fragmented landscape. Brands may need to measure each engine separately rather than assuming visibility in one will carry over to another.
Where This Comparison Has Real Limits
I want to be direct about how much weight this carries. Each engine ran once per prompt, on different days, under different conditions. Claude had some account context available that ChatGPT’s fresh chats did not. Google AI Mode is missing complete five-prompt data for two categories, and running shoes is missing even its general-query result, which is why that category sits outside the agreement count entirely.
I also did not rerun any single prompt to check for variance inside one engine, let alone across all three. A different day could shuffle some of these results. What I can say with confidence is what each engine returned when I asked, in the order I asked it, during this specific round of testing. I also only tested three of the AI tools people use for shopping research, not the full range available now.
The Bottom Line
After three separate 50-prompt tests, the clearest finding is the 44 percent cross-engine agreement rate. Less than half of the nine fully comparable categories produced a unanimous answer across ChatGPT, Claude, and Google AI Mode on the plainest possible question. Two of those nine agreed on nothing at all.
Osprey’s total lock on ChatGPT and near-absence of that same lock in Claude and Google AI Mode is the single best example in this whole comparison. Winning one AI system’s shopping answer does not mean winning the others. That is the number worth remembering here. Forty-four percent.
Related Reading
Is It Possible to Track Brand Mentions in AI Answers?
Google AI Mode Product Recommendations: 50-Test Study
Claude Product Recommendations 2026: I Tested 50 Prompts
How Does ChatGPT Decide What Products to Recommend?
Do News Websites Block AI Crawlers? I Tested 13 Major Publishers
How I Found My Own AI Search Visibility Gap
HubSpot AEO Grader Review (2026): I Tested It on My Website
How to Check AI Visibility for Free (With Real Data From My Site)
AI Visibility Benchmark 2026: I Tested 9 Leading SEO Websites
FAQ
Does this prove which AI shopping engine is the most accurate?
No. This measures whether the three engines agree with each other, not whether any of them recommended the objectively best product. Agreement and accuracy are different questions.
What is the Cross-Engine Agreement Rate?
It is the share of fully comparable categories where ChatGPT, Claude, and Google AI Mode named the same brand on the plainest “best [category]” query. In this test, that rate came out to 44 percent full agreement, 33 percent partial agreement, and 22 percent complete disagreement, based on nine categories with a complete general-query result across all three engines.
Why does laptops count if the Google data was incomplete?
The concentration table needs all five prompts per category, and Google’s laptop data only had two of those preserved, so it shows as incomplete there. The agreement comparison only needs the single general-query answer, and that one result survived intact for laptops. Running shoes did not have even that much preserved, which is why it is the one category excluded from the agreement count.
Why do some categories agree across all three engines while others do not?
I cannot say for certain from this data. Categories with one clear reputational leader, like moisturizers and CeraVe, tended to agree more. Categories with many valid, similarly strong options, like air fryers and travel backpacks, fragmented instead.
Should a brand only optimize for one AI shopping engine?
Based on this comparison, that looks risky. Strong visibility in one engine did not reliably predict strong visibility in the other two, especially in categories like backpacks where the three tools gave three unrelated answers to the same question.
Will these results hold up if the test is run again?
Some might, some might not. Each prompt ran once per engine during a specific testing window. The structural patterns, like the four-way ecosystem split in smartwatches, look more durable than any single product pick, since that same structure showed up independently in all three engines.